From HO Racing's High Output newsletter
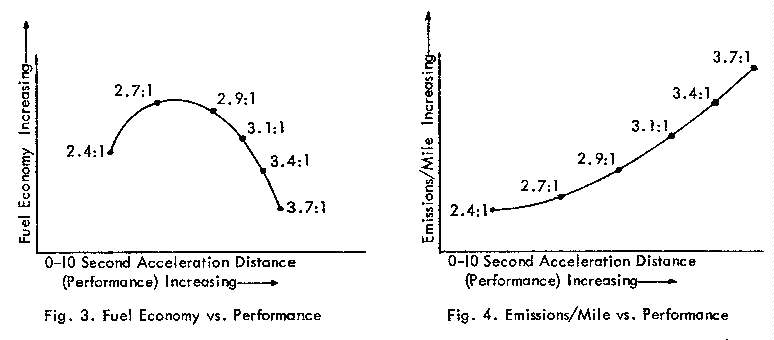
As most Pontiac fans realize, changing rear gear ratios can yield a tremendous performance increase. Three questions sometimes arise when considering a change in rear end ratio: How will the change affect top speed?, How will the change affect fuel economy?, and How will the change affect exhaust emissions?
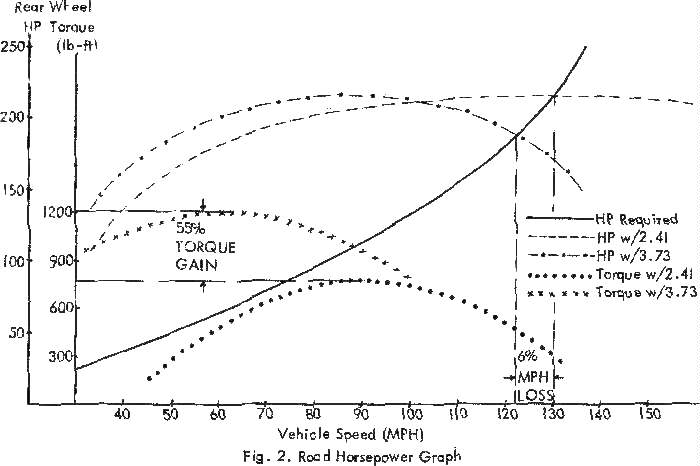
A change in rear gear ratio can be one of the most satisfying modifications you can make on your Pontiac, and it can be one of the most cost effective. For instance, changing from a 2.41:1 ratio to a 3.73:1 ratio will provide a rear wheel torque increase of 55%.
Figure I below is a chart of rear wheel torque increases; to find the torque increase for a proposed gear ratio change, find your present ratio in the left column and move across to the column that is headed by the proposed ratio, the percentage shown is the torque increase (negative percentages are torque decreases).
| Torque Increase | |||||||||||
| Proposed Ratio | |||||||||||
| 2.41 | 2.56 | 2.73 | 3.08 | 3.23 | 3.42 | 3.55 | 3.73 | 3.90 | 4.10 | ||
| 2.41 | 6% | 13% | 28% | 34% | 42% | 47% | 55% | 62% | 70% | ||
| 2.56 | -6% | 7% | 20% | 26% | 34% | 39% | 46% | 52% | 60% | ||
| 2.73 | -12% | - 6% | 13% | 18% | 25% | 30% | 37% | 43% | 50% | ||
| 3.08 | -22% | -17% | -11% | 5% | 11% | 15% | 21% | 27% | 33% | ||
| Original Ratio | 3.23 | -25% | -21% | -15% | - 5% | 6% | 10% | 15% | 21% | 27% | |
| 3.42 | - 3 0% | -25% | -20% | -10% | - 6% | 4% | 9% | 14% | 20% | ||
| 3.55 | -32% | -28% | -23% | -13% | - 9% | - 4% | 5% | 1 0% | 15% | ||
| 3.73 | -35% | -31% | -27% | -17% | -13% | - 8% | - 5% | 5% | 10% | ||
| 3.90 | -38% | -34% | -30% | -21% | -17% | -12% | - 9% | - 4% | 5% | ||
| 4.10 | -41% | 32 - -38% | -33% | -25% | -21% | -17% | -13% | - 9% | - 5% | ||
| Fig 1 | Wheel Torque Changes | ||||||||||
Providing you can get it to the ground (have sufficient traction) the 55% torque increase should substantially improve your quarter mile E.T. and push you back in the seat a lot harder! On the street,the drivability and responsiveness will be greatly improved.
There are some interesting points to ponder in a rear gear change. For instance, a 1978 Firebird with -the standard 400 (non T/A 6.6) engine originally equipped with 2.41:1 gears. With this combination the torque peak occurs at about 52 mph and the horsepower peak occurs at about 118 mph. The same gear with 3.73:1 gears reaches the torque peak at about 34 mph and the horsepower peaks at about 76 mph. The 3.73 gears convert this car from a "Freeway Cruiser" into a "Surface Street Stomper" that would have tremendous response at around town speeds and would probably get the best fuel economy at city speeds of 30-40 mph.
Now, consider a 1978 Firebird with the T/A 6.6 engine. When using 2.41:1 rear gears the torque occurs at about 92 mph and the horsepower peak occurs at about 131 mph - With 3.73:1 gears, T/A 6.6 car reaches the torque peak at about 59 mph and the horsepower peaks at about 85 mph
The 3.73:1 gears convert the T/A 6.6 car from a "Freeway Flyer" into a good highway or multipurpose car.